How to Analyze Lane Profitability
Use TruckerProfit's Lane Profitability dashboard to identify your most and least profitable routes. Data-driven decisions for higher earnings per mile.
Why Lane Profitability Is Your Growth Map
Not all miles are created equal. A load paying $2.80/mile on a 200-mile lane with no detention and low broker fees might be more profitable than a $3.00/mile, 2,000-mile lane with 15% broker fees and 4 hours of unpaid detention. Lane profitability analysis strips away the gross rate and shows you the real net profit per mile for every lane you run. Once you know which lanes make money and which lose money, you stop guessing and start optimizing.
- 1Make sure you have at least 5-10 analyzed rate confirmations in Broker Fee Killer (data feeds the lane analysis)
- 2Navigate to Broker Fee Killer → Lane Profitability
- 3Review your lanes sorted by profit per mile
Reading the Lane Profitability Table
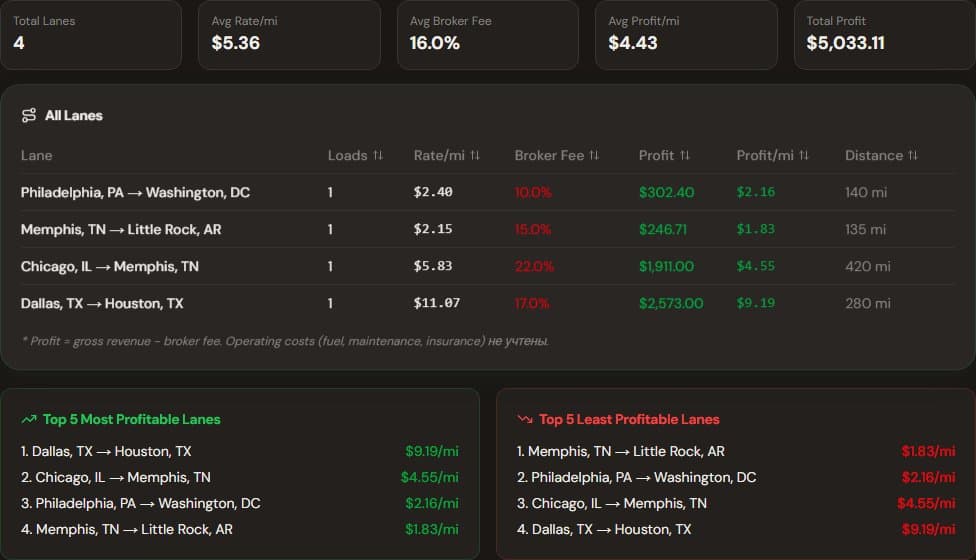
Green = profitable, red = losing money
- 1The table shows every origin→destination pair you've run, sorted by profit per mile (highest first)
- 2Columns: Origin, Destination, Loads, Avg Rate/mi, Avg Broker Fee, Avg Profit/mi, Total Profit
- 3Green rows = profitable lanes (above your break-even CPM). Red rows = money-losing lanes
- 4Click any lane to see the individual loads that make up that lane's data
Top 5 Most and Least Profitable Lanes
- 1The dashboard highlights your top 5 most profitable lanes — these are your gold mines
- 2It also shows your 5 least profitable lanes — these are candidates for rate renegotiation or elimination
- 3Sort by broker fee percentage to see which brokers charge the most on your best lanes
- 4Use this data to prioritize brokers: send more volume to brokers on profitable lanes, negotiate better rates on marginal lanes
Pro Tip
A lane that's unprofitable at current rates might be worth keeping if it leads to a profitable backhaul. Look at lanes as round trips, not one-way loads.
Making Data-Driven Decisions
- 1Identify your top 3 profitable lanes and run them more frequently — build relationships with those brokers
- 2For marginal lanes (profit under $0.10/mi), try negotiating: 'I run this lane 3x/month. At $2.40/mi it's tight. Can you do $2.55?'
- 3For money-losing lanes, either renegotiate or stop accepting — every load that loses money must be offset by profitable loads elsewhere
- 4Re-check lane profitability monthly — markets shift, and a lane that was profitable last quarter may not be today
Warning
Don't abandon a customer entirely based on one lane. If a broker has profitable lanes elsewhere, focus on those and decline only the unprofitable ones.
How TruckerProfit Helps
- 1Lane Profitability auto-calculates net profit per mile from your actual rate confirmation data — no manual spreadsheets
- 2The dashboard updates automatically with every new analysis in Broker Fee Killer
- 3Top 5 / Bottom 5 views give you immediate actionable insights without digging through data
- 4Bulk CSV export lets you share lane data with your accountant or use it for carrier packet submissions